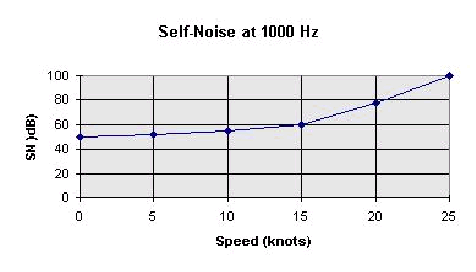
:-) this is graph of sonar self-noise, so it's conected with hydrodynamic, "flow" noise. Well, it's even not flow noise itself but "sonar self noise" ! Flow noise at zero speed should be rather zero don't you think ? So I guess on your graph it's combination of sonar self noise with flow noise.
First, nobody said flow noise is linear :-). But the noise generated by a sub so combination of few kinds of noise, al low speeds machinery noise predominates, at high speeds in modern subs rather flow noise predominates. The flow noise is not linear. But this graph don't look good for me. Because from what I know the flow noise in general is proportional to sixth power of the speed (may be other power at lower speeds maybe). So it's raising curve as you think. BUT it is not raising curve if you plot it on a logarythmic graph !! It becomes the opposite then, because logarytm or a^x is stronger function than even x^6. On your graph the noise is in dB and speed in kts - and the curve is raising. This would lead to an absurd on the very right side of the graph, because more you are going to the right (higher speed) faster the noise (in dB) raises, so at some point increase of speed by 1kts would lead to several dB of noise increase so noise would double or raise 10 times with 1kts of speed increase ! Don't you feel something is wrong here ?
The graph of flow noise can't raise higher and higher on the right.
So even if this graph of sonar self noise is correct (because for example it's determined not only by flow noise but other things) it has not much to do with submarine self-noise which is combination of flow noise and few other kinds of noise. If sonar self noise is combination of constant base 50dB + flow noise, then it could look like on your graph but you'd be surprised how it looks more to the right :-).
Well ok I have found my Excel spreadsheet with noise calculations and made a combination of constant base NL and a flow noise. After a while I have found a combination of parameters that give quite similar result, look (click on the lower graph to enlarge):


Look at the red line, looks quite similar. But the first impression is wrong, when you take a second look at what happens more to the right and understand what's happening - it's actually a dB scale sum of constant 20dB noise with a flow noise. Look at second graph, it's same function but showed more to the right and with the flow noise part showed in black, as you see the red line is starting from base 20dB but later it becomes more and more similar to the black line.

The black line is flow noise and I guess it's quite different from what you could expect. But the red line, sum of 20dB and flow noise at first look quite different than it becomes later. So not always looking at begin of an graph can give you good understanding of what will happen later, if you don't know what function or sum of functions the graph shows. The begin may look quite different from the rest of graph.
But I think the graph you showed is not very precise and maybe also the sonar flow noise at low speeds is little different function because it don't look like speed^6 function. So it's either more complicated (and even less connected with submarine noise) or not very precise...