Quote:
Originally Posted by B_K

Coppied from http://www.subsim.com/radioroom/showthread.php?t=233393
From what I read and managed to figure out, the BRC works like this:
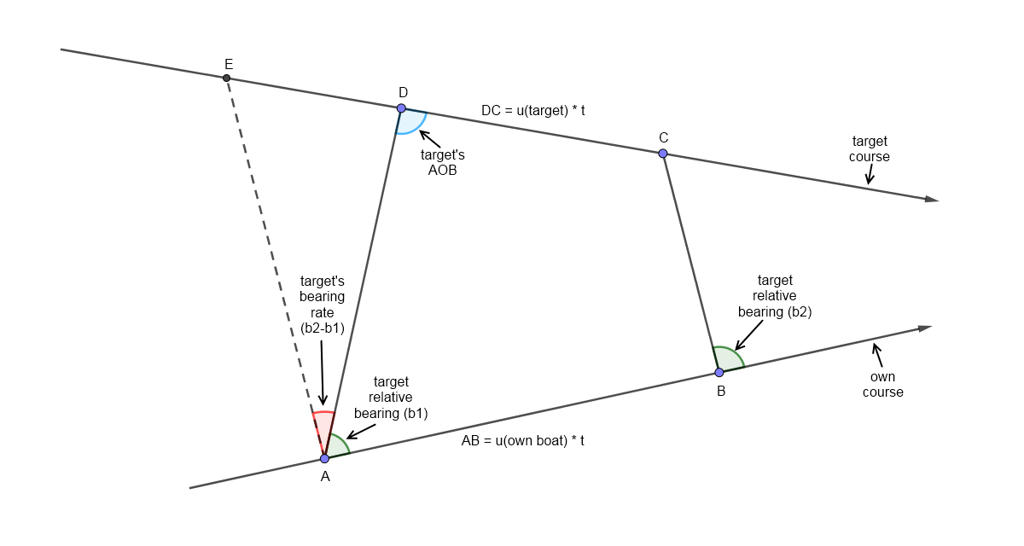
1) construct LOS diagram
2) you know target relative bearing - you know the first angle of which sine is needed
3) find target's AOB - you now know the second angle of which sine is also needed
4) find target's speed
5) find target's bearing rate
now:
- since you know ownship speed, point 90 degree mark (innermost disk) on that speed and read speed across the LOS where target bearing angle is - this is the first speed component. You multiplied your speed by sinus of target bearing angle.
- do the same with target's speed and AOB
- add both speeds to get total relative speed across the LOS
- turn bearing rate value to that calculated speed
- read the range estimation
In my opinion that is the basic principle of BRC operation. OFC this is only my guess from what I read, but it's quite possible they did it like this.
I think we should ask Admins to move the original thread and continue here. |
oh,Thank you very much B_K for your very usefull reply

i think that i am very close getting to it but still haven't totally got it

for example, the time between the two bearings must be fixed at 1 minute (for using the tool) or i am free to time as much i want between the two bearings ?
also you say ''You multiplied your speed by sinus of target bearing angle'' ,the question is that this calculation will be done with a digital calculator ?
The
final range etsimation output
of the tool is the range at first bearing or something else? [i am suspecting that the 'key' value to be calculated is the segment ED(which can easily be found).Then , with the law of sines on triangle ADE , the range at first bearing (AD) can finally be calculated] -- see at the pic
if it is not big deal for you , i would like you to make a graph showing ,with an example, all the above .that will help very much and ,for sure, clear all my questions
ps:
Have a look at this (did i understand right your data?):